Sale on canvas prints! Use code ABCXYZ at checkout for a special discount!


Art Website Reviews & Traffic Data - Selling Art Online
There are hundreds of websites on the internet that offer to help you sell your artwork. In fact, new sites appear almost every single week. Unfortunately, there isn't enough time in the day to join them all... and even if there was, most of us would quickly become overwhelmed trying to maintain multiple sites with our newest releases and price changes.
As a result, you have to determine which websites are most likely to generate sales for you and are worth your time, money, and marketing efforts. When evaluating the relative merits of one site versus another, there are many important factors to consider, including:
1) What types of selling tools are available (e.g. prints-on-demand, custom shopping carts, e-mail marketing, etc.)?
2) What types of artwork can you sell (e.g. prints, originals)?
3) What is the commission percentage on sales?
4) What are the base prices for printing and framing materials?
and more...
Most artists do a great job of researching each of these factors before deciding to register with an art site.
Unfortunately, however, one of the most important factors to consider is often overlooked:
5) How many visitors does the site attract each day?
and equally important...
6) How many of the visitors are members versus non-members?
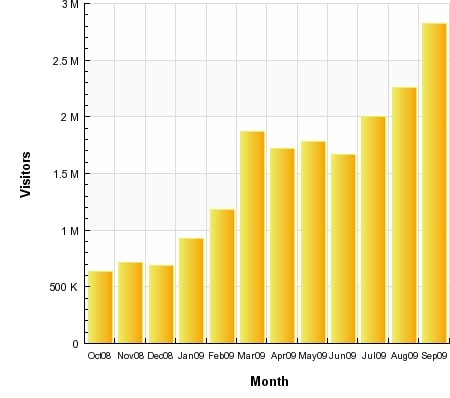
The graph, above, shows actual traffic statistics for FineArtAmerica.com as obtained from our tracking service (SiteMeter). The graph was plotted on September 30th, 2009. The total visitor count for September 2009 was 2.85 million visitors.
To help answer these questions, we're going to do something rarely seen in the online world: we're going to publish our actual traffic data (above) and then compare those numbers to other popular art sites. The results are shown, below... and they may surprise you! For a complete explanation of how these numbers were calculated and what they mean, please scroll to the bottom of the page.
Website Traffic Data
Visitors Per Day
VPD
Number of Members
NM
Non-Member Visitors Per Day
NMVPD = VPD - NM
Visitors Per Day Per Member
VPD / NM
Independent Tracking Data

125,000
25,000
100,000
5.00
Summary: FineArtAmerica receives an even mix of regular visitors and passers-by.

70,000
100,000
0
0.7
Summary: 71% of all visits to RedBubble.com are generated by the members (i.e. addicts).

50,000
50,000
0
1.0
Summary: ImageKind receives an even mix of regular visitors and passers-by.

10,000
40,000
0
0.3
Summary: 27% of the visitors to Fine-Art.com are generated by the members (i.e. addicts).

8,000
39,000
0
0.2
Summary: ArtistRising receives an even mix of regular visitors and passers-by.

8,000
25,000
0
0.32
Summary: 35% of all visits to ArtWanted.com are generated by the members (i.e. addicts).

8,000
20,000
0
0.4
Summary: MyArtSpace receives an even mix of regular visitors and passers-by.

6,000
8,000
0
0.8
Summary: 29% of all visits to Yessy.com are generated by the members.

6,000
4,000
0
1.5
Summary: 89% of all visits to Boundlessgallery.com are generated by the members.

1,000
400
600
2.5
Summary: Zibbet does not have enough visitors to track.

1,000
500
500
2.0
Summary: DiscoveredArtists does not have enough visitors to track.


1,000
????
0
0.0
Summary: 50%+ of all visits to ArtID.com are generated by the members.
There are 12 websites in this list. You can view them all by using the inner scroll bar on the right or by clicking here.
How is this data useful?
How were these numbers calculated?
The only numbers, above, that are known to be absolutely, 100% correct are the FineArtAmerica numbers. The other numbers are estimates... but they're very good estimates, and here's why:
There are several independent websites that keep track of visitors statistics for the entire internet, such as Alexa.com, QuantCast.com, and Compete.com. These sites work the same way that election polls work. They monitor the behavior of a small group of internet users and then attempt to approximate the behavior of all internet users by employing statistical analysis. The "small group of users" agree to be monitored by installing a tracking toolbar in their web browser (like the Google toolbar, Yahoo toolbar, StumbleUpon toolbar, etc). The toolbar tracks each website that the user visits and then transmits the data back to the tracking company. Alexa.com claims to have several million people who use their Alexa toolbar and agree to be tracked.
Each of the tracking companies publishes daily and/or monthly reports for each website on the internet. For example, shown below is a report from Compete.com which compares the monthly visitor totals for FineArtAmerica.com, ArtistRising.com, and RedBubble.com:
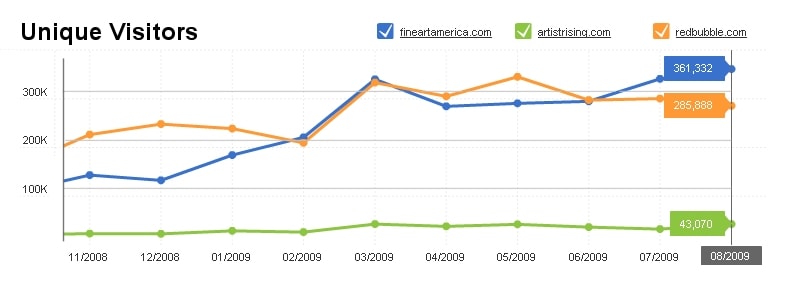
FineArtAmerica
ArtistRising
RedBubble
Should you believe this graph? Let's look at another graph from a completely different company. Here is a graph from QuantCast:
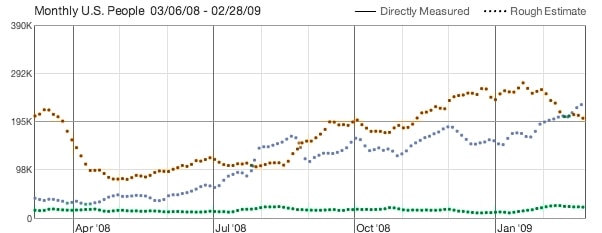
FineArtAmerica
ArtistRising
RedBubble
It's virtually the exact same graph... from a second, independent company. So - it's safe to assume that the tracking companies do indeed know what they're doing.
If you're paying close attention, however, you may have noticed that the numbers in the independent tracking graphs are noticeably lower than the numbers reported in the "FAA only" graph at the top of the page. For example, the "FAA only" graph shows that we received 1.4 million visitors in February 2009. That's roughly six times larger than the 225,000 visitors reported by Compete and QuantCast. What explains the difference?
There are two main reasons:
1) There are different ways to count visitors.
2) The independent graphs are only "estimates" and are oftentimes conservatively low.
When counting visitors, the FAA tracking program defines a visit as "a series of page views by one person with no more than 30 minutes in between page views". So, if you visit FAA at 10:15 AM and then come back to view some additional pages at 10:32 AM... you would count as only one visit because the elapsed time between page views is 17 minutes. However, if you then take a break and don't come back until 12:00 PM, that would count as a second visit (elapsed time = 1 hour and 28 minutes since your last visit).
So, if the independent tracking companies decide to use a different time frame between page views... or decide to only count each visitor once per day... or once per month... you end up with different results.
Without going into further details, here is how we arrived at the numbers listed in the website comparison table, above. We calculated that, over the past year, the independent tracking companies have reliably reported our numbers at about 1/6 of their actual values (as reported by our own tracking program). For example, if the tracking companies reported that we received 225,000 visitors in a given month (e.g. February 2009)... then our own tracking program reported that we receive 1.4 million... and so on.
It's safe to assume that this 6x relationship holds true for the other art websites, as well. For example, RedBubble.com reported in February 2009 that they received 70,000 visitors per day (source). If you multiply that number by 28 days, you get 1.96 million visitors... which is 9x the number reported by the independent tracking companies. It's not exactly 6x... but RedBubble probably exaggerated their numbers a little bit for the press (like any company would). I can tell you from experience that even though FAA averages 75,000 visitors per day, that number drops to around 55,000 on Saturdays, for example.
The finish off this section, here is the end result:
The numbers in the table, above, were calculated by taking the numbers from the independent tracking companines and multiplying by 6. Please note, the numbers in the table are visitors per DAY instead of visitors per MONTH.
What do these numbers mean?
If you've made it this far, here come the big surprises (to some people):
1)
FineArtAmerica receives more visitors each day than any art website of it's kind!
2)
FineArtAmerica is the only site that attracts a significant number of non-members (i.e. potential buyers). We attract 125,000 daily visitors with only 25,000 members (5:1 ratio of visitors / members). ImageKind, in comparison, attracts 50,000 daily visitors... but they have 50,000 members (1:1 ratio).
Summary
Visitor traffic is just one of many factors to consider when choosing an art site. If you want to simply upload your images and then wait for orders to roll in, traffic statistics should be very important to you. You need to be on a site that receives a lot of visitors per member.
On the other hand, if you intend to aggressively promote yourself through e-mail marketing and other means, visitors statistics are somewhat irrelevant to you. You're not going to be sitting around waiting for buyers to find you on one of these websites... you're going to go find buyers on your own! In this case, it's more important that you choose an art site that has good selling features, low commissions, good marketing features, and a nice, user-friendly layout.
If you have any questions regarding the data and graphs on this page, please feel free to contact support - at - fineartamerica.com.
To view the complete list of selling features on FineArtAmerica.com, click here.
Thank you for stopping by.